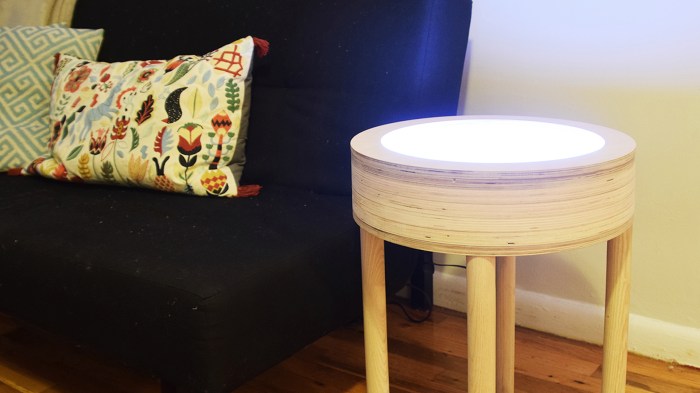
Final:

Timelapse clips:
Project Objective:
The aim for this project is to make visible the amount of CO2 in the air. While we know CO2 is constantly around us, it is disturbing that we can’t see it. This air quality lamp table is an attempt to visualize this invisible data.
An air quality sensor that is powered by a solar panel is situated on a windowsill. The sensor records the temperature and CO2 concentration in ppm (particle per million). This information is sent wirelessly to Air Lamp which reflects the data using RGB LEDS. The white color means extremely low CO2 values, yellow is low, peach is medium, red is high, magenta is extremely high.
About the data:
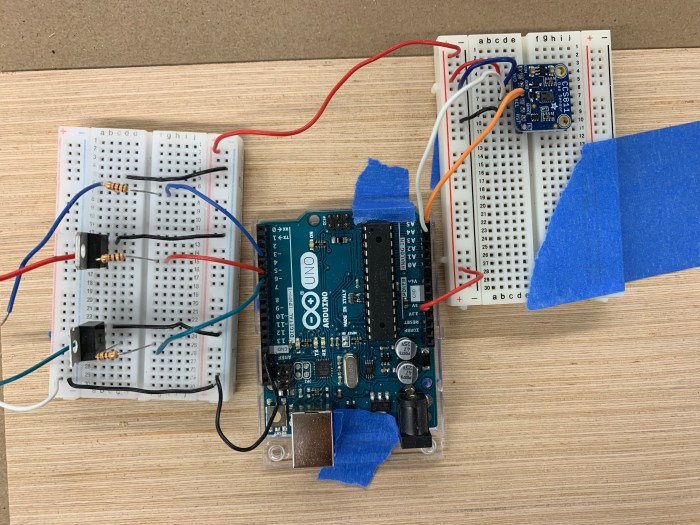
For this project, I data logged using an Arduino MKRZero. I was able to document in the course of a day the amount of CO2 in the air, time of day and the temperature. After data logging, I came to a rough hypothesis that the amount of CO2 correlates with the amount of human activity in the environment (i.e. people starting their day or getting off work). The CO2 level also spikes when it’s immediate surrounding is activated by factors, such as a person walking by or alcohol in its air.
Credits:
Special thank you to Professor Tom Igoe, Jeff Feddersen, Kasra Sardashti and resident Hayley Hwang.
Steps this Week:
1.) Drawing the final dimensions for the CO2 light table. After doing 2 cardboard mockups of different sizes, I decided to make it 16″ diameter. The drastic increase in size is because I decided that the magnets should be half the width of the circle to make for the most visually appealing design. It was also this big to fit the large height of my Nema 17 motor.
2.) I transferred my drawings into Vectorworks then to the CNC. I am finally getting the hang of the CNC and really feel like me and the CNC are friends!

The total height of the fixture needed to be at least 3.345″ in order to fit the stepper. So, I had 7 layers of 1/2″ and 3/4″ wood to cut. Here they are all stacked.
3.) After getting the rims cut. I cut the bottom base and top rim. I also had designed an under-the-table enclosure for the Arduino and circuit to live in. The circuit enclosure was hand cut.

4.) The next step was cutting the opaque acrylic pieces. From last week, I knew that the 1/4″ or 1/2″ opaque acrylic pieces would be the best for diffusing the LEDs. Initially, I had the acrylic piece designed so that it would be an enclosure for the magmet, mineral oil, iron powder. I also had holes cutout for attaching it to the hub of the stepper motor.


5.) I tried attaching the stepper motor to the magnet holder and creating the enclosure. I even sealed the enclosure with silicone glue to hold the mineral oil. Unfortunately, after creating it I realized that the stepper could not handle the weight of this large 16″ acrylic enclosure. It was too much weight for the stepper to handle and would not make rotation cycles easily anymore.


6.) After realizing at the 11th hour that this motor, magnet, iron powder idea would not be achievable within the next few days I grudgingly scoped the project down. Instead of using this motor mechanism to show the change in CO2 levels, I decided to just focus on the colors of the lights to represent the data. From this decision on, the project felt much more manageable.
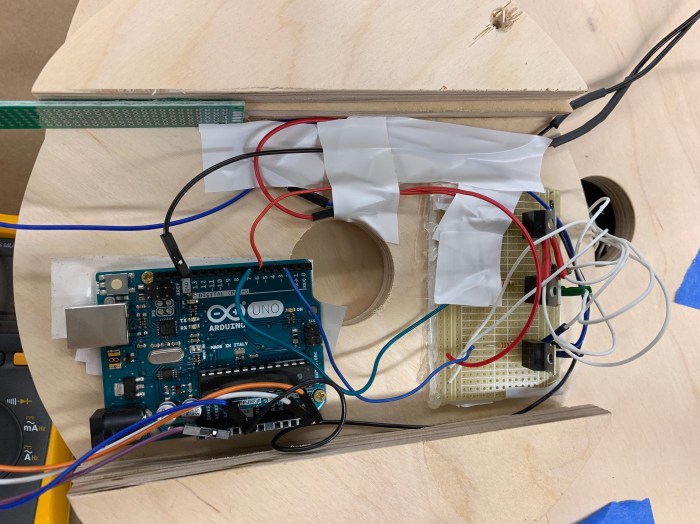
After realizing that, circuit changes and code changes were made. My circuit became very minimal in comparison to the one with the stepper motor.
Here is the previous one with the stepper motor breakout.

I was also able to focus on putting together the rest of the lamp fixture.

7.) Next was wiring up the LEDS. I wanted to make sure there was no spottiness with the lights but also be light enough to be a nice ambient light. So I really overloaded the inside fixture with tons of LED strips.
8.) Next was soldering all the components to a perfboard.
9.) Then came putting it all together: the wooden lamp fixture, the Arduino and the circuit

10.) The code was it’s own messy story. It was worked on it multiple series. First with just the stepper motor on its own sketch. Then, with the leds and the sensor by themselves. I also got some help from a couple of people (Kasra and Hayley) to figure out how to do data averaging and not have the LED not react to each reading. Instead, it now averages and checks to make sure that the previous reading is/isn’t the same as the current reading. Here is the final “super code”:


—
Steps for data logging can be seen in the previous blog: https://emilylinprocess.blog/2019/04/29/light-energy-wk-12-co2-clock/
—
Previous posts on process:
https://emilylinprocess.blog/2019/04/23/light-energy-wk-11-co2-light/
https://emilylinprocess.blog/2019/04/10/light-energy-wk-10-24-hr-light/
