When Love

when love floods a person
            it cuts
a canyon

that deepens year after year
            carrying silt
away leaving

the essential person
            revealed
letting everyone see

the layers of yellow
            sandstone, red basalt
grey granite

when love washes over a person
                        it washes
the person away

– Alicia Ostriker

That is solemn we have ended,— (87)

That is solemn we have ended,—
     Be it but a play,
Or a glee among the garrets,
     Or a holiday,

Or a leaving home; or later,
     Parting with a world
We have understood, for better
     Still it be unfurled.

Emily Dickinson

Trash Club: Website

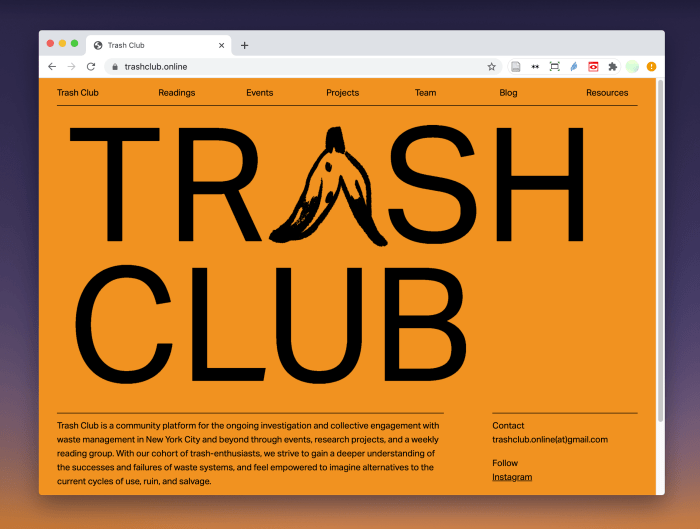
Excited to continue working with Rashida and Morgan on Trash Club! We’ve been dreaming up Trash Club 2.0 and what the future of this humble organization can look like.

Lately, I’ve been specifically working on the logo, visual design, and web design for our site. It’s been fun times! Sharing some progress with both design and code below. Morgan purchased a domain name. Rashida then took the html, css I’ve been working on and Jekyll-fied it. So wonderful that she converted it into a site that we can update using markdown – will have to aim to use Jekyll for another project.

Check out: trashclub.online!
(always WIP, always adding more)

Screen Shot 2020-09-02 at 8.03.29 PM

Some helpful references she shared to help with this:

Other helpful references:

Data + Publics: Finals

The Evolution of COVID-19 is a web-based Interactive project that visualizes the evolution of the global Covid-19 Crisis since December 1st, 2019, the day when the symptom onset of the first patient was identified(1). Each date on the timeline will contain information of major events related to Covid-19, as well as worldwide data including number of total cases, active cases and total deaths.

For this project, I worked with Huiyi, Rui, Qice, and Viola. I mainly focused on the visual design and creating the p5js virus-y code effect. Huiyi and Viola worked on the data collection, Rui worked on the three.js part + back-end, and Qice worked on the back-end.

This is a longer term project than we had imagined, partly because many of us (including myself) have been focused on completing our thesis. However, I managed to finish the the p5js ‘creative coding’ portion for the home and about page. Also, created the sketch designs, sharing some mockups below. Will aim to help with front-end + data collection/editing now.

Much more to come with this project!

Screen Shot 2020-04-11 at 7.50.07 PM

Some Code Sketches I created of the Virus Logo

p5 sketch of the about page background
p5 sketch for the logo

Coding Resources for Making Drop Shadows with HTML5 API + p5js:

Data + Publics Wk 5: d3js

Link to site
Link to code

This dataset represents ferrous metal mines in the United States. It is based on the data collected from the Minerals Information Team (MIT) of the U.S. Geological Survey, and the operations are those considered active in 2003 and surveyed by the MIT. Dataset from data.world.

Resources:

Data + Publics Wk 2: Data Drawing

For the assignment to create a data visualization (using non-digital tools) on a postcard that shows a ‘snapshot’ of a particular slice of a public data set, I chose to use the NYC Department of Health and Mental Hygiene’s dataset on NYC Restaurant Inspection Results.

I was thinking of sending it to my cousin, who got food poisoning when he visited NYC a couple months ago.

Scan_datadrawingScan_legend

Legend shows: (1) each violation type has their own pattern, (2) each restaurant type has their own color, and (3) critical/not critical changes the box’s drop shadow direction.

Below is the final postcard:

posrcard_set

Data + Publics Wk 1: Reading Reflections

1.) Turning the Data Around

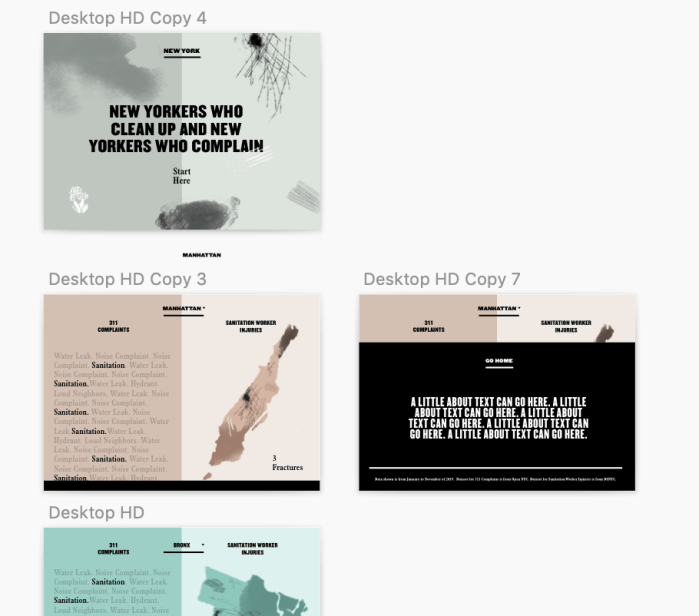
This article’s general sentiment to “consider the human” resonates strongly with me. The idea that data visualization should benefit the community or people in which the data is taken from seems only right. Reading this article, also makes me reflect on all the past data visualization projects I have done. I can’t help but wonder if our ‘New Yorkers who Clean Up and New Yorkers who Complain’ piece helped sanitation workers in any way – did it give back to them? Did any of my previous ‘Data + Art’ projects do that? I would like to think that it helped shed light on the fact that garbage collection is a dangerous job, but did it? Did it benefit the workers? How would I improve upon my previous data projects using this mindset of ‘turning the data around’? How would they feel if they saw the data visualization? Would they feel like their issues were being heard? Would they feel like they had been part of a study they didn’t agree to be a part of? Or worse, would they feel uncomfortable seeing this? I cringe thinking about it, but it’s very possible that it made them uncomfortable and not heard. It would have been better to get to know sanitation workers, to get to know the people first – not just make a data visualization. Good to be self-critical. It’s helpful reading this article and keeping in mind the community in which the data is taken from. I’d also like to know more ways to empower the people whom data is collected from other than putting it in a public setting.

2.) Chapter Two: On Rational, Scientific, Objective Viewpoints from Mythical, Imaginary, Impossible Standpoints

A great saying the article repeated was “data visceralization not visualization.” Designing for viscerlizations requires a much more holistic embodiment from the person. As the article mentions multiple times, it’s important to keep in mind that objective, rational “truths” are impossible. The argument to keep data “objective” is faulty in that everyone’s “truth” is different. We live in a subjective, non-binary world full of many unique truths. Another great point is the idea that novel representations of data are much more memorable than a typical bar graph. Even the “chart junk”, which are illustrated data visualizations, are more unique and therefore more effective. It was helpful to read this and remember that when making my own data visualizations it is important to a.) show not tell, b.) think of unique forms to represent this data, c.) convey the emotions of the dataset, and d.) design for “data viscerlizations” which require a “holistic conception of the viewer” and treats viewers as more than just a pair of eyes.


Data + Publics Wk 1: Open Data NYC Zine

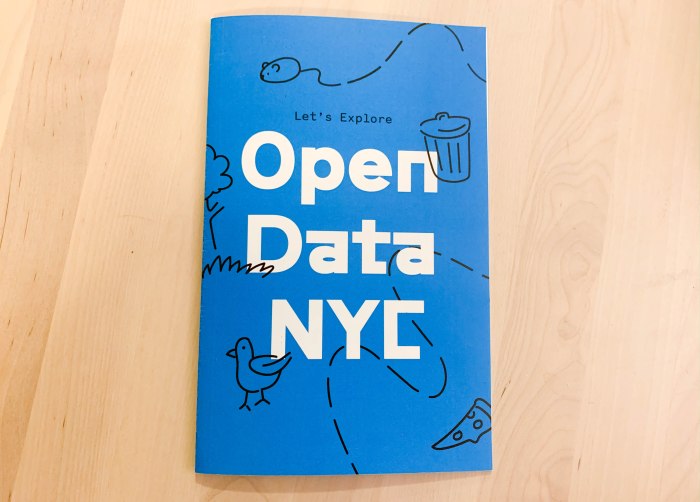
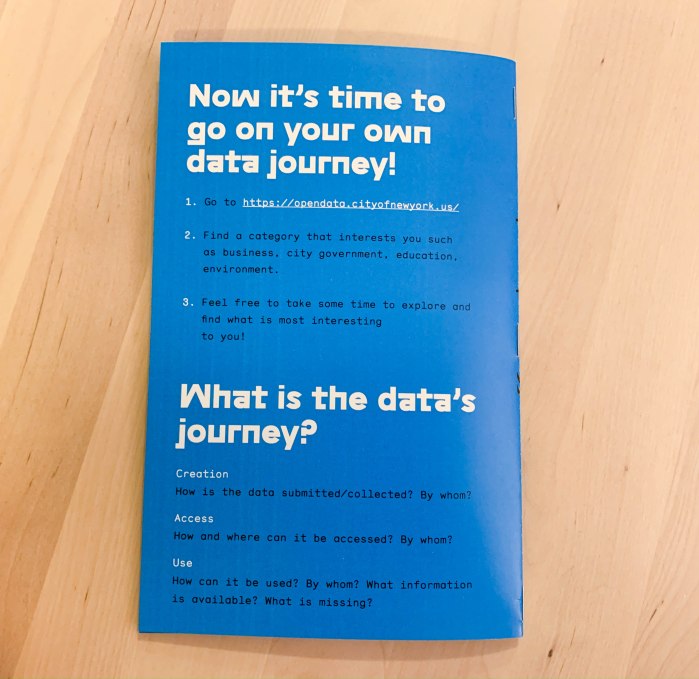
Lydia and I worked together to make a zine about Open Data NYC! We covered: a.) the history of Open Data NYC and what it is, b.) what are 311 calls, c.) how to submit a 311 request, d.) how to access 311 data, d.) how to use that data, f.) what are the biases involved, and g.) what is missing from the data? We also included an activity guide for others on the back. This was fun to make – we hope to continue with this and make more data how-to guides!

book-8book-1

book-6book-7

Setting Up Domain Name, Server & SSL: Notes

My NYU hosted website doesn’t work anymore, so I’m trying to get my previous live web + data art projects that use an ssl certificate up and running again. In hopes that I don’t forget how to do this, I’m documenting my process of hosting my own domain name, getting my own server, and registering for ssl certificates. Should be simple, but let’s see!

Step 1: registered for a new domain name on Dreamhost. My new domain name: dadododoes.tech

Step 2: Created a new droplet on digital ocean.

Step 3: Added a SSH key. This video was quite helpful in understanding how to get a SSH key on my DigitalOcean. With all this set up I am now able to ssh in using terminal

ssh root@ipaddresss

I am also able to log into fetch server:

Hostname: ipaddress
Username: root

Step 4: point my DigitalOcean name server from common Domain Registrar. This was a helpful video and article.

Step 5: updating my previous code with new ssl certificate and rsa private key that DreamHost has provided.

Step 7: ran into a lot of issues with not being able to run “node server.js” in my terminal once my file was in fetch. realized i have to install node in it. must use these commands to install node. live web class page has a helpful tutorial for this.

apt-get update
apt-get install nodejs
apt-get install nodejs-legacy
apt-get install npm

Step 7: also had to reinstall forever

Step 8: on Digital Ocean it needs to have the ‘www’ added to the url name that points to the ip address.

To get ssh key content:

pbcopy < ~/.ssh/id_rsa.pub


Live Web Wk 11-13: Final

Final: https://el3015.itp.io:3128/play.html

Final code: here

About:

Sound of Color is a web and mobile app that visualizes the relationship between color and sound frequency.

Process:

Final project proposal

Process

Steps for this week: a.) fix the line animation on the “draw” page/finally get that to work properly, b.) style the page: resize the pixelate canvas to be full width, c) animate the playhead, d.) fix the mouse move sizing issue, e.) get ipad camera to be facing out/ not user, f.) Billy to work on converting the sound frequency I have into midi notes, g.) the speed plays back faster every time you play and pause in ‘playback’ mode

a.) fix the line animation on the “draw” page/finally get that to work properly

It now animates! Many thanks to Shawn’s logic advice! It needed to go in a main draw loop and also needed an array that the sine lines selected would be pushed into.

But other issues emerged…for ex: it draws the full history of the lines selected. meh! this took way too long to figure out. but perhaps this is the solution? https://stackoverflow.com/questions/23092624/socket-io-removing-specific-listener

Tried a bunch of things with the “socket.off” and “socket.removeEventListener” but still not working. Need to ask Shawn/Mimi.

Screenshot 2019-11-29 09.03.33.png

Great, asked and turns out it was a simple solve! canvas.removeEventListener was the right code to use! Turns out I was just removing the line that draws the sine wave, when i needed to remove the whole function. Below is the winning script that works (this seriously took way too long to get)!

   redSelect.addEventListener('click', () => {

        evl = drawRedSine;

        let removeRed = (e) => {

            console.log('evl for red: ' + evl)

            console.log(e);

            let p = {

                x: e.clientX,

                y: e.clientY

            };

            socket.emit('sendRedData', p);

            console.log("EMITTED RED");

            canvas.removeEventListener('click', removeRed);

        }

        var listener = canvas.addEventListener('click', removeRed);

    });

b.) Resizing context + canvas to be full width (see d for answer)

Question: when i resize the canvas to be full width, the mouse pick is still picking from the same context size. it is not picking from the right pixel/ context didn’t seem to scale with the canvas.

c.) Animating the shape in playback mode

How to return value from a setInterval()? Having issues with the rectangle drawing across the screen…when it is drawing in setInterval(), it disappears too quickly because it is drawn every 500 miliseconds.

Never mind! fixed. All I had to do was draw the shape in the loop function.

d.) the mouse move was not choosing from the canvas.

The issue was that the canvas width was set at 100vh in css. so the actual video that was being drawn into the canvas was not the full window width. Figured out that you have to set the canvas width and height in the javascript.

the key code:

   ctx.canvas.width = window.innerWidth;

    ctx.canvas.height = window.innerHeight;

    //set video full width

    video.width = window.innerWidth;

    video.height = window.innerHeight;

e.) to get camera to face out I had to use ‘facingMode: ‘environment”

  let constraints = {

    audio: false,

    // video: true,

    video: {

      facingMode: "environment"

      // facingMode: 'environment'

    }

  }

f.) Converting frequency sounds to notes. Thank you Billy for converting the frequency to actual notes! woo!

g.) Fixing speed increase! This took so long but thank you Craig for helping troubleshoot this one! so the issue was that the enableFakePick() already has an event listener so it just kept adding to it when I was doing another event listener in the drop down selection part. What needed to happen was just to get rid of the event listener in this drop down part. part below is the winning code!

if (i === 1) {

letplayButtonDiv=document.getElementById('bottom-button-play-div');

letpauseButtonDiv=document.getElementById('bottom-button-pause-div');

playButtonDiv.style.display='inline-block';

evl=i;

console.log("evl:"+evl);

if (evl!=null) {

letplayButtonDiv=document.getElementById('bottom-button-play-div');

playButtonDiv.style.pointerEvents='auto';

console.log('playback');

enableFakePick();

//playButtonDiv.addEventListener('click', enableFakePick); //enable play button

}

//remove mouse pick function

document.removeEventListener('mousemove', enableMouseMove);

} else if (i === 2) {

//document.removeEventListener('click', enableFakePick);

evl=i;

if (evl!=null) {

// show color with pick function

console.log('mouse move');

document.addEventListener('mousemove', enableMouseMove);

}

letplayButtonDiv=document.getElementById('bottom-button-play-div');

playButtonDiv.style.pointerEvents='none'; //disable play button

}

Helpful Resources:

Credits!

Biggest thank you to Professor Shawn for constantly solving the technical issues I ran into. So appreciate all the help and for steering this project in a better direction. I learned so much regular javascript from doing this project and from being in Live Web- very grateful I took this course.

Shout out to sound expert Billy Bennett for converting the frequency sounds into midi notes! It sounds infinitely better!!

Also, thank you so much the last minute troubleshooting help, Dan Oved and Professor Mimi.